DEA
DEA Parameters
Not runDEA Help
Differential Expression Analysis Overview
Differential Expression Analysis (DEA) identifies genes that are significantly up- or down-regulated between different cell clusters, helping to characterize cell types and states within your single-cell dataset.
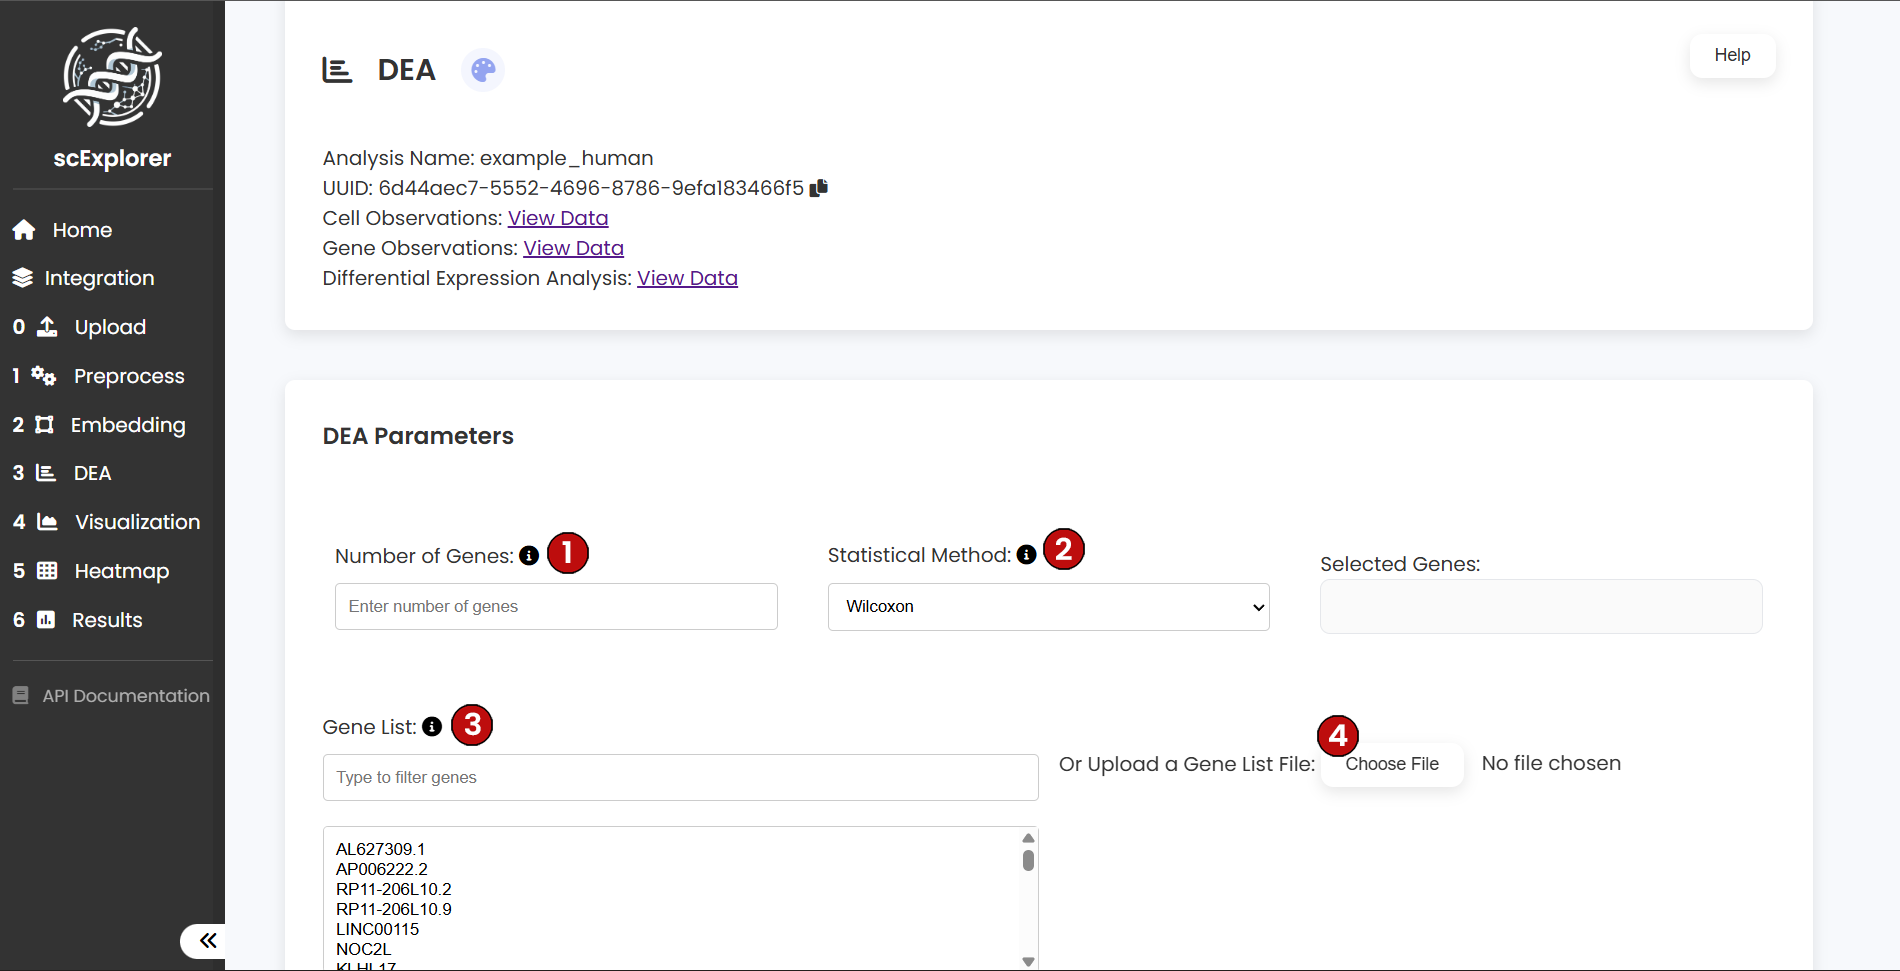
Parameter Configuration
To begin your DEA, configure the following parameters:
- (1) Number of Genes: Select the number of genes to be plotted per cluster (maximum of 8)
- (2) Statistical Method: Choose the statistical method to be employed (Wilcoxon or t-test)
- (3) Custom Gene List (Optional): Define specific genes you want to visualize
Once your selections are made, click Run (4) to start the analysis.
By default, the analysis filters results to display only genes with an adjusted p-value < 0.05<. For each gene and cluster, the following are computed:
- Mean expression: Average expression among expressing cells
- Log fold change (logFC): Comparing expression in the target cluster vs. all other clusters
Only genes with a logFC ≥ 0.25 and mean expression ≥ 0.1 are considered for visualization, unless a custom list is provided.
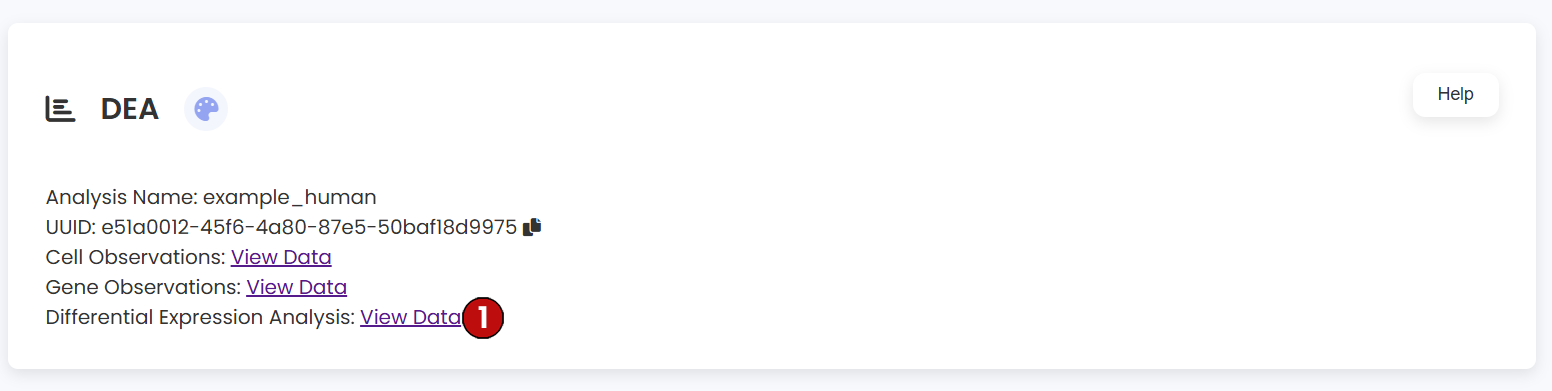
DEA Results Table
After running the DEA analysis, a new dataframe table is added to the dataset information section. This table provides access to cell observations, gene observations, and the DEA results.
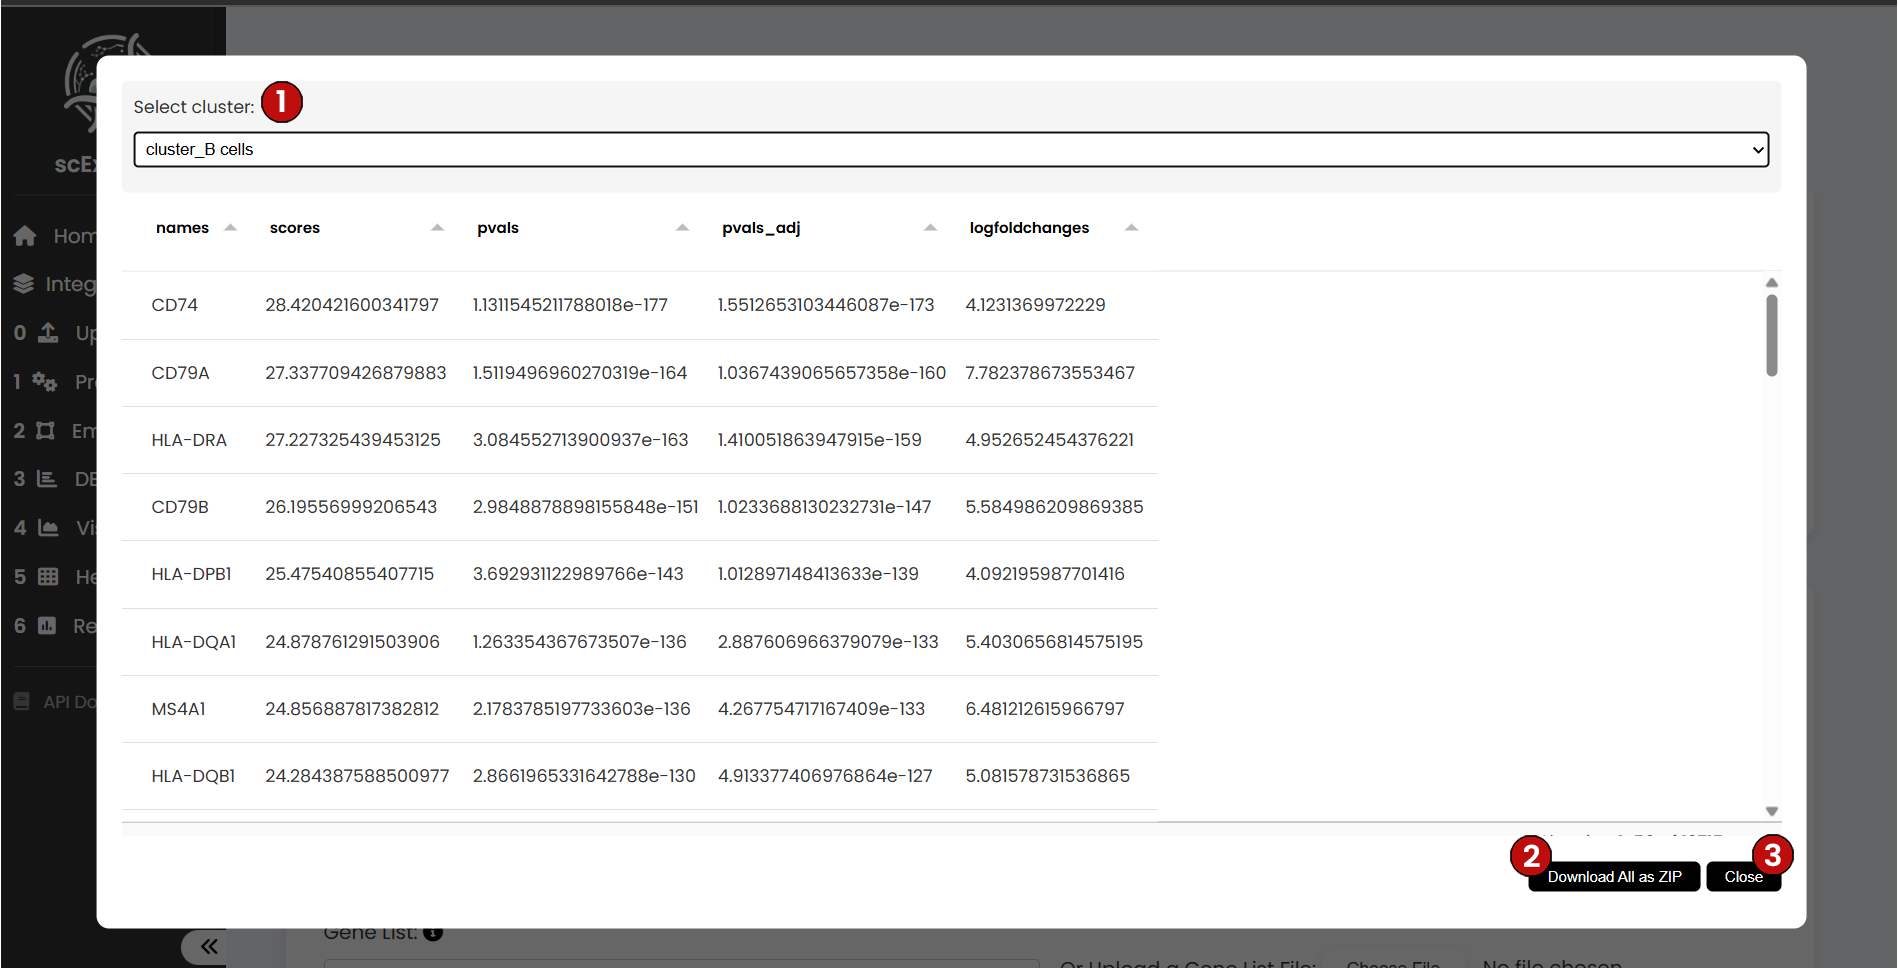
When viewing the DEA results, the interface allows you to:
- (1) Select a cluster of interest
- (2) Download all DEA genes as a ZIP file
- (3) Close the table and continue with the pipeline
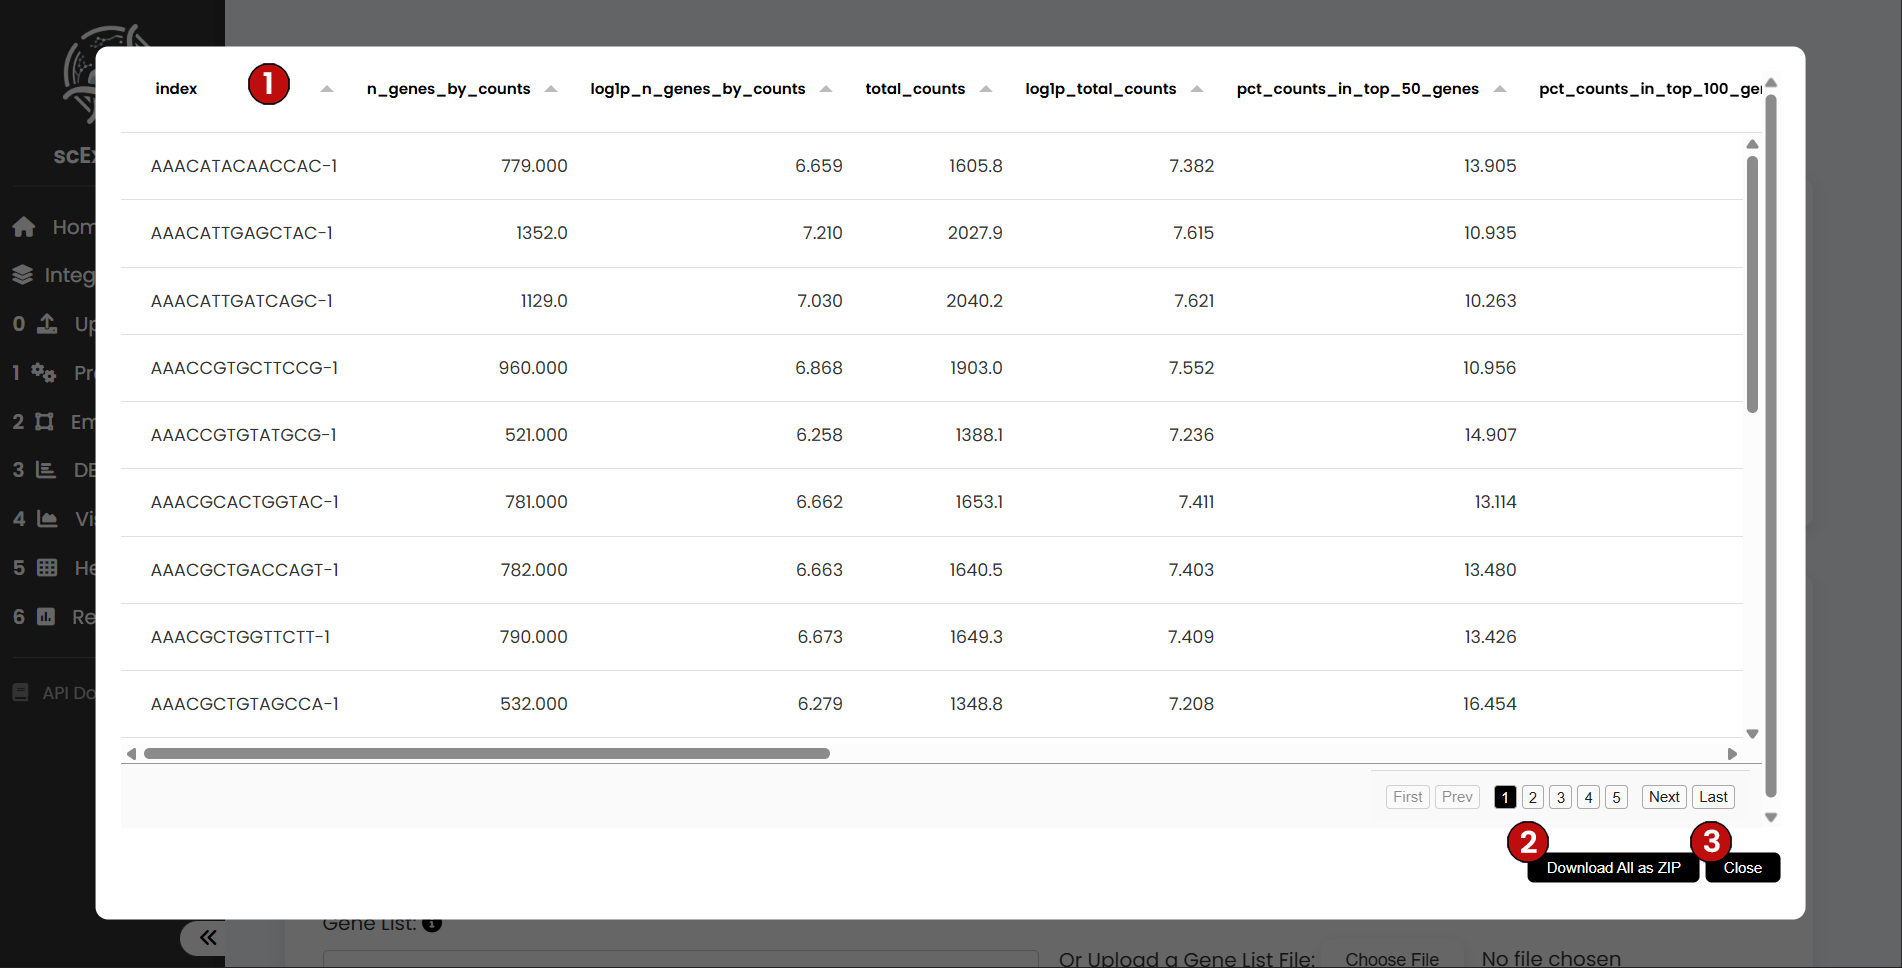
Cell Observations
The Cell-level Observations table summarizes per-cell QC and metadata across the pipeline. Typical columns include the unique cell identifier, the number of detected genes, total counts/UMIs, percentage of mitochondrial reads, doublet flags (if enabled), and current labels (e.g., Leiden clusters or user-assigned labels). As you proceed through preprocessing, embedding, labeling, and DEA, new cell-level metrics are appended to this table for traceability.
You can download the table for offline inspection and close the view to continue the workflow.
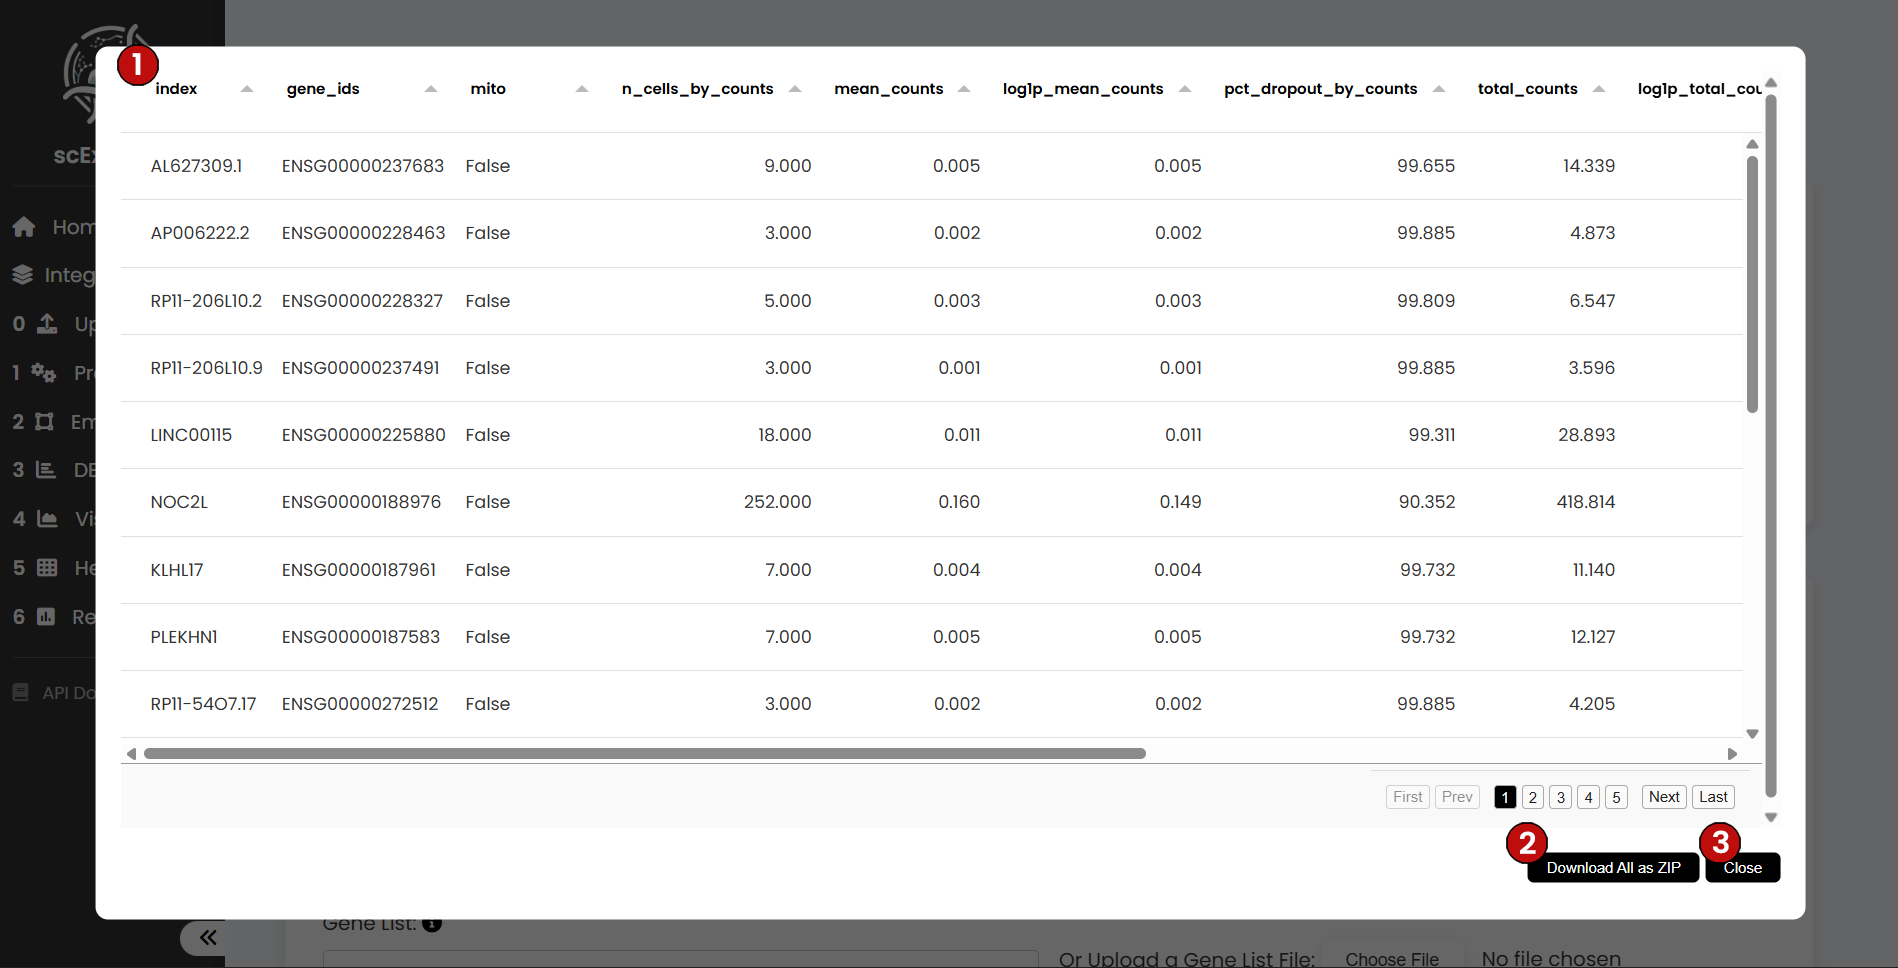
Gene Observations
The Gene-level Observations table aggregates per-gene metadata and summary counts. Typical columns include the gene identifier, total counts, detection rates, and categorical annotations (e.g., mitochondrial/ribosomal). Downstream steps add gene-level statistics where relevant. Use this view to verify feature nomenclature, track filtering impact, and cross-reference DEA markers.
The table can be downloaded, and you can return to the pipeline at any time by closing the view.
Results and Visualization
After running the analysis, you will see:
- (5) Download Link: A link titled "Differential Expression Analysis" will appear above, allowing you to download the complete DEA results per cluster
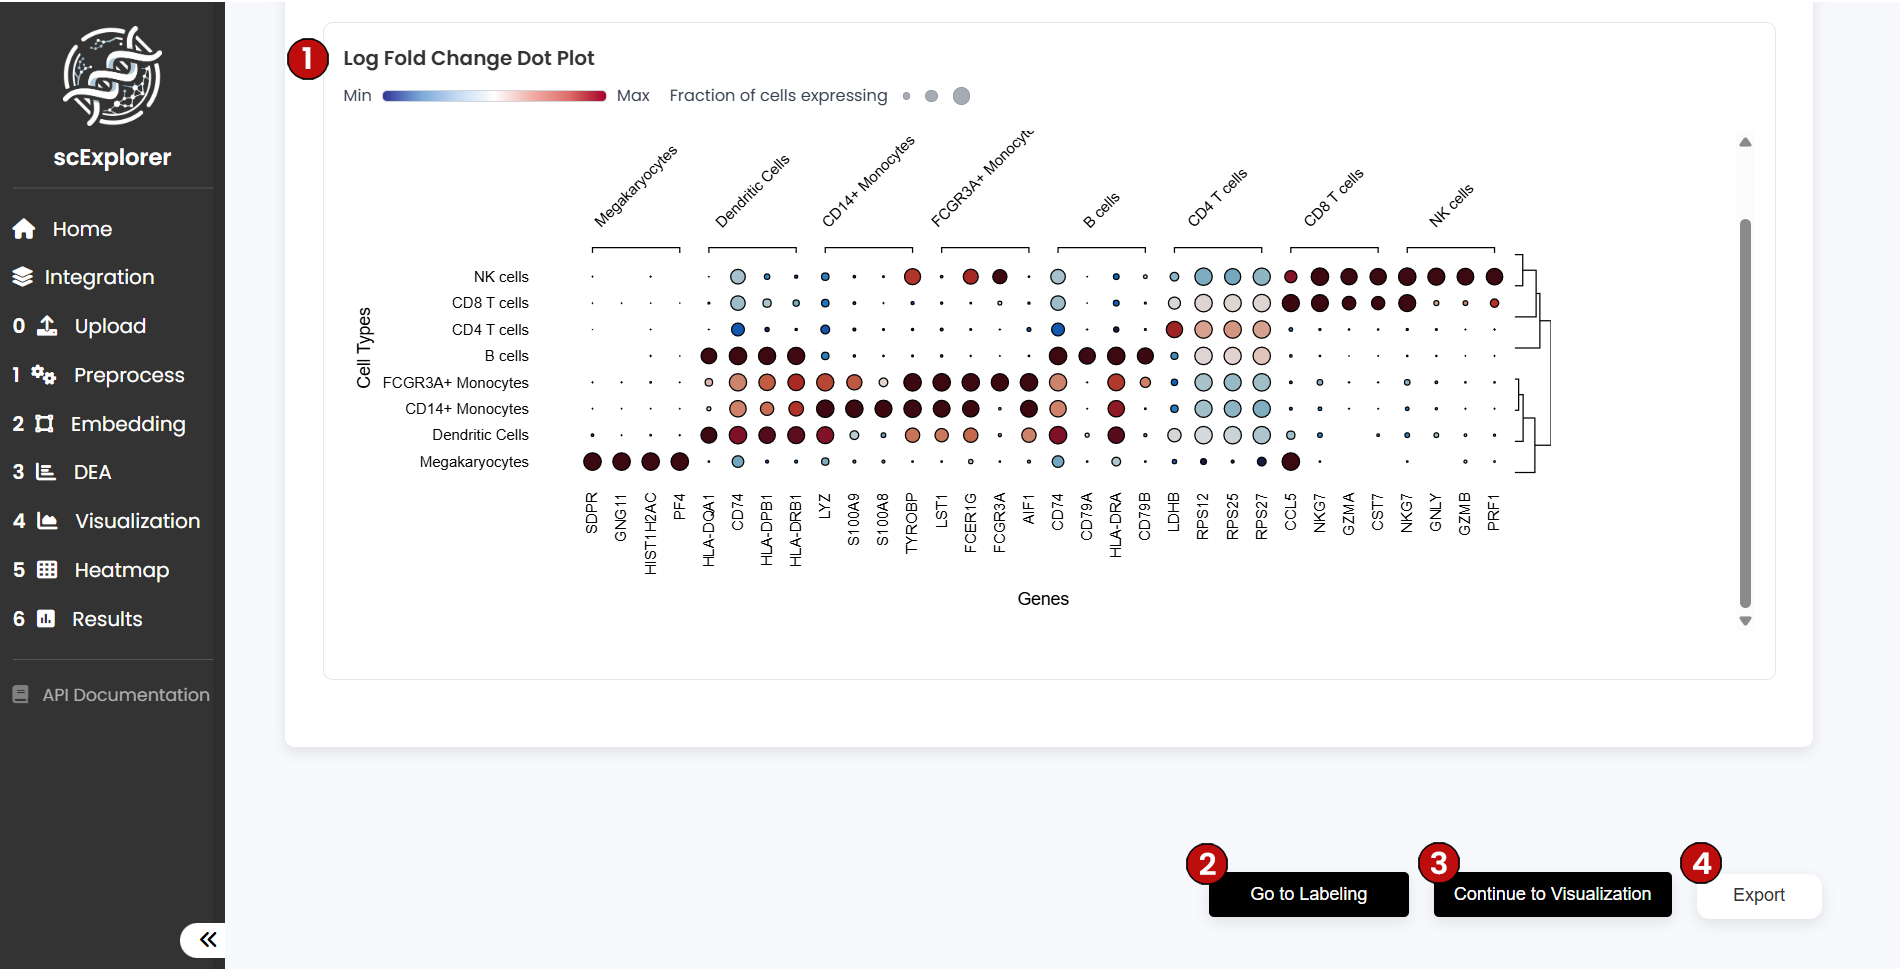
- (6) Dot Plot Visualizations: Two dot plot visualizations will be generated below
Understanding Dot Plots:
- Dot color: Indicates whether the gene is up- or down-regulated
- Dot size: Reflects the percentage of cells within each cluster that express the gene
Finally, click Continue to Visualization (7) to plot selected genes in UMAP or PCA space for spatial insight.