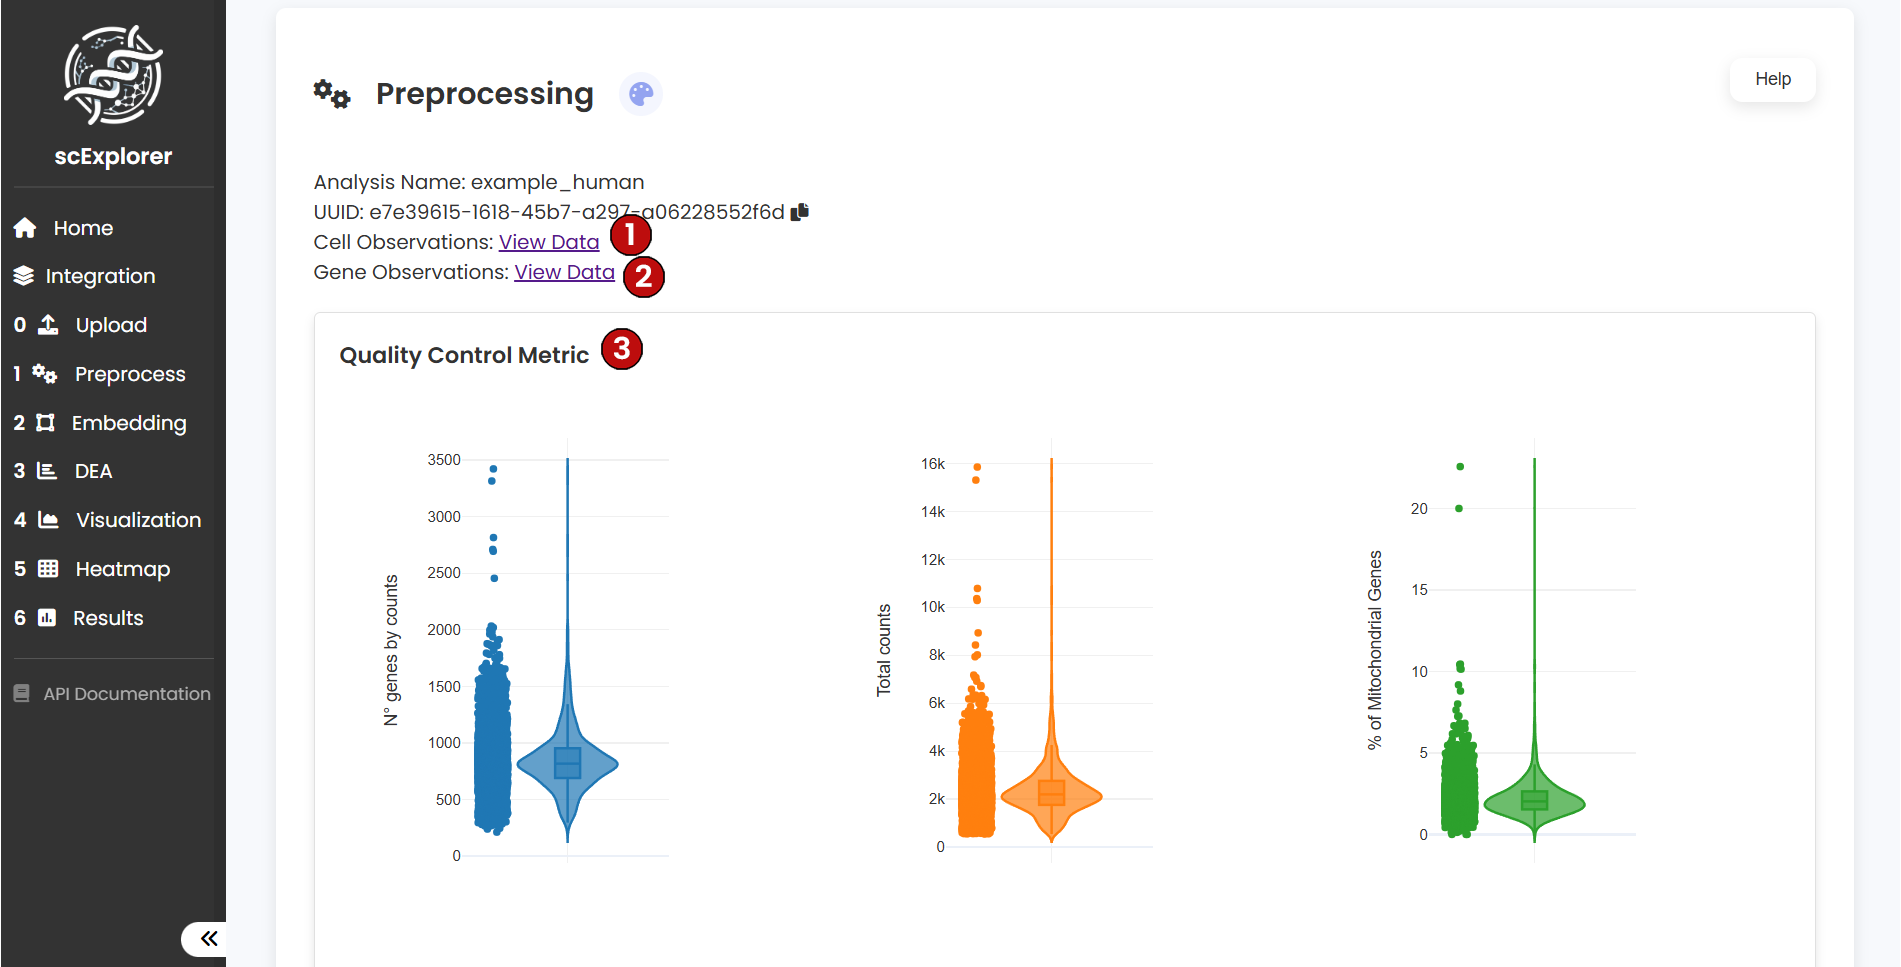
At the top of the preprocessing section, you will find two summary tables: the Cell-level Observations table (1) and the Gene-level Observations table (2). These tables contain the first quality metrics generated right after uploading your data. As you move forward through the pipeline, new information will automatically be added to these tables.
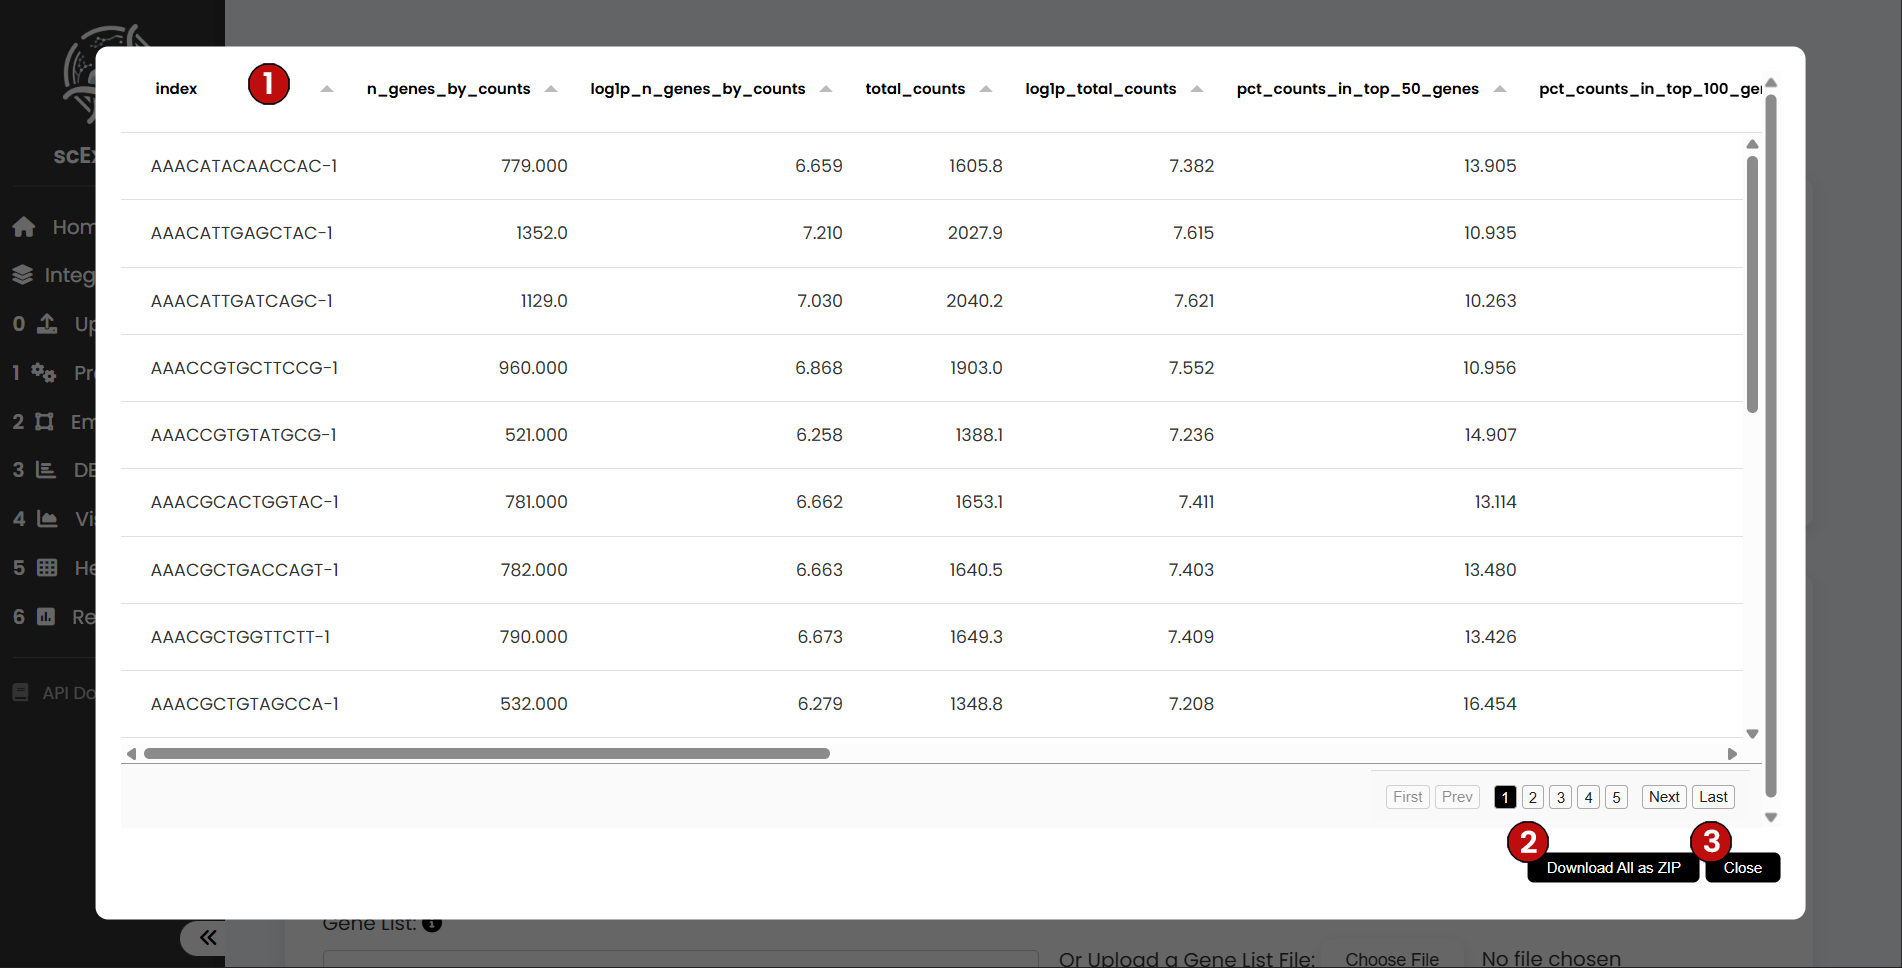
For the Cell-level Observations table, you will see details such as the unique identity of each cell (1), the number of genes detected per cell, the total counts, and other relevant metrics. As the workflow progresses, any new cell-level metrics will be stored here. This table can also be downloaded (2), and you can return to the pipeline view at any time by clicking the close button (3).
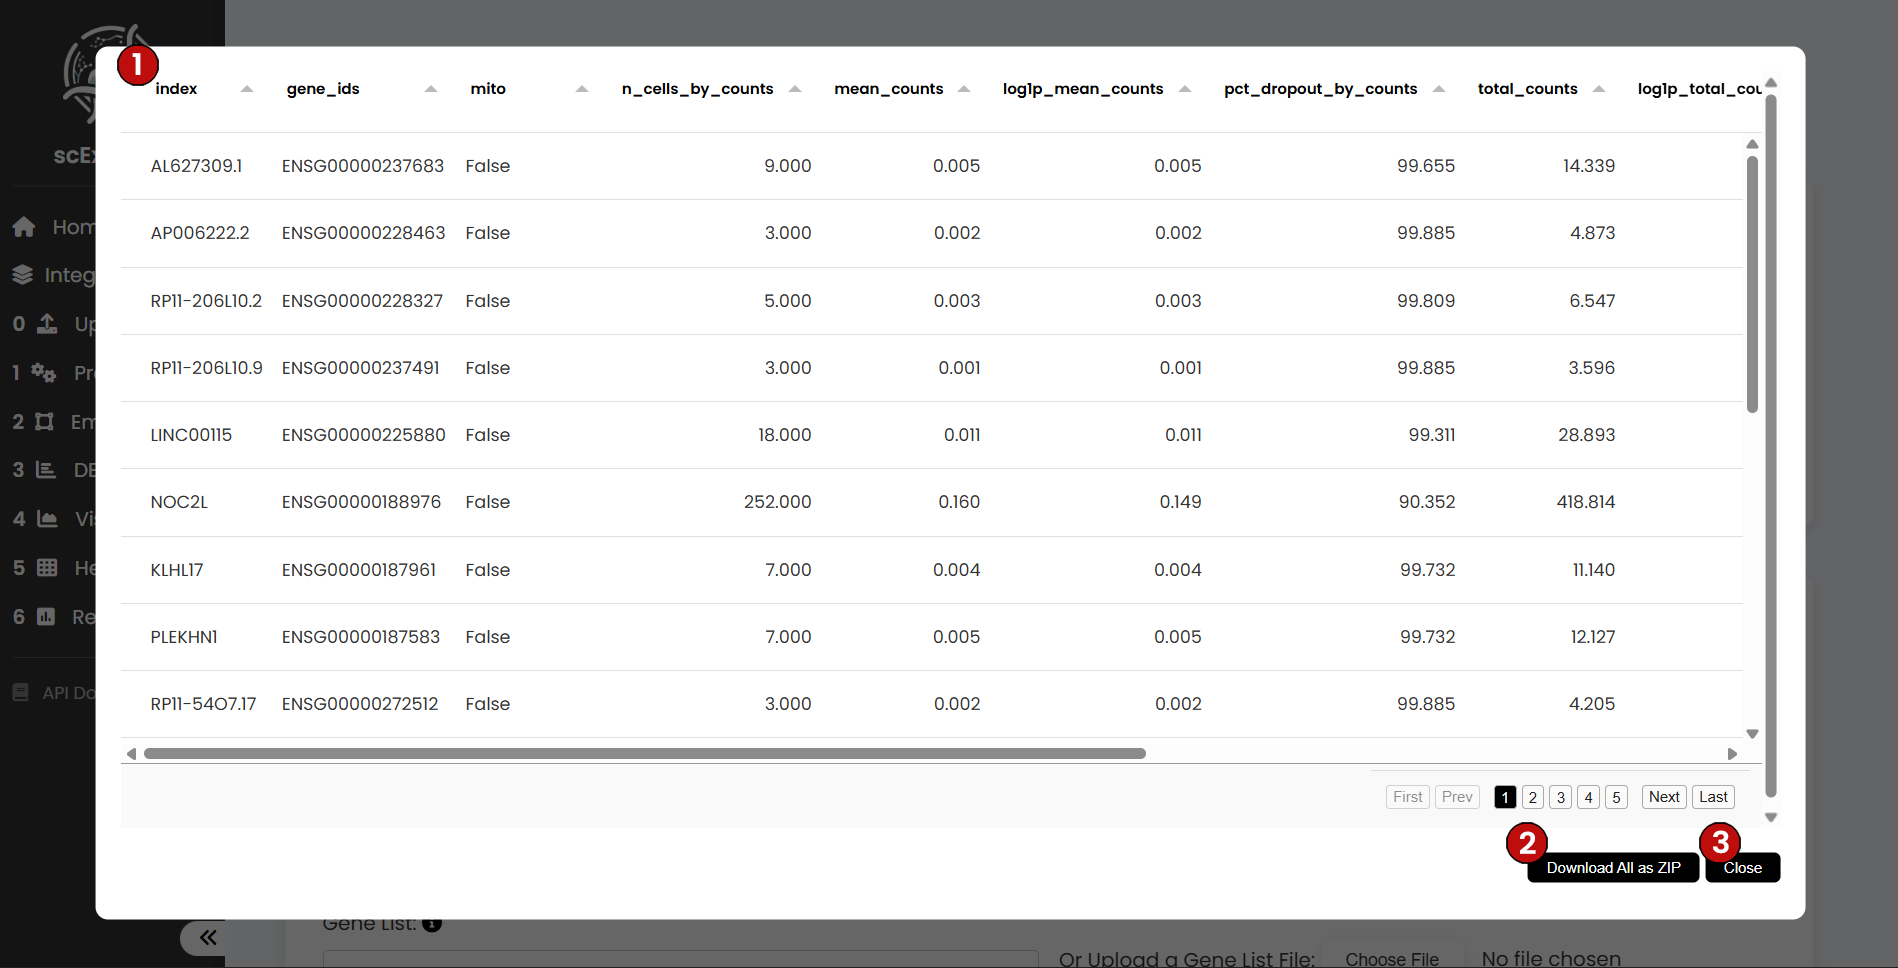
For the Gene-level Observations table, you will find the gene ID (1), the total counts per gene, and whether a gene is annotated as mitochondrial, ribosomal, or other categories. As with the cell table, any new gene-level metrics produced during the workflow will be added here. This table can also be downloaded (2), and you can return to the pipeline with the close button (3).
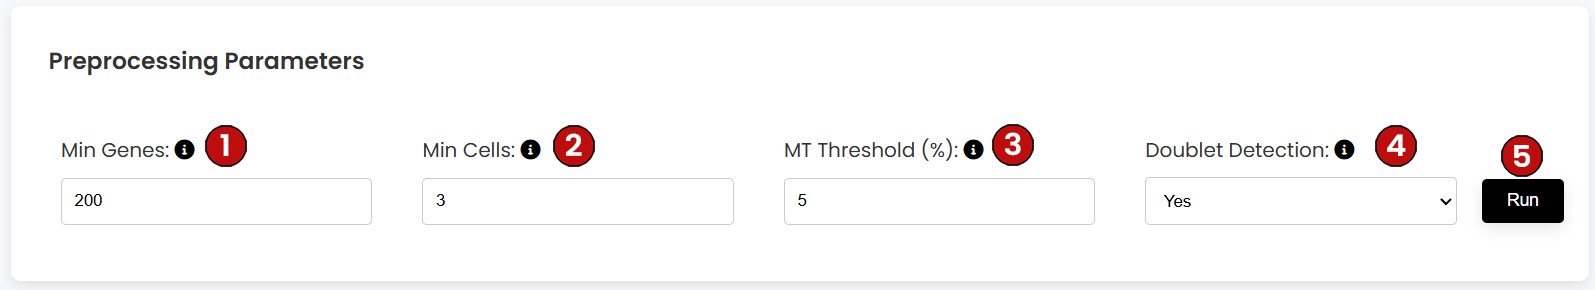
During preprocessing, you can filter your dataset according to four parameters:
For this tutorial, we will use the default parameters: 200 Min Genes, 3 Min Cells, 5% Mitochondrial Threshold, and Doublet Detection enabled. Once you set these values, click on Run (5).
Preprocessing of single-cell data is a crucial step for accurate identification and characterization of cell types, states, and biological mechanisms. Thus, proper data preprocessing will improve downstream analysis.
A good starting point to explore the preprocessing parameters is those recommended by Seurat and Scanpy developers such as 3 for Min Genes, 200 for Min Cells, and 5% for Mitochondrial Threshold. However, we encourage users to explore multiple parameters since the best will vary across datasets, species, platforms, etc.
For instance, a systematic analysis determined that a mitochondrial threshold of 5% distinguishes high- and low-quality cells in mouse samples whereas in human failed to discriminate in one third of the datasets.
Droplet-based single-cell methods generates doublets, which are two cells in one droplet. Thus, elimination of doublets is a key step during preprocessing since single-cell methods assumes that each droplet contains only one cell.
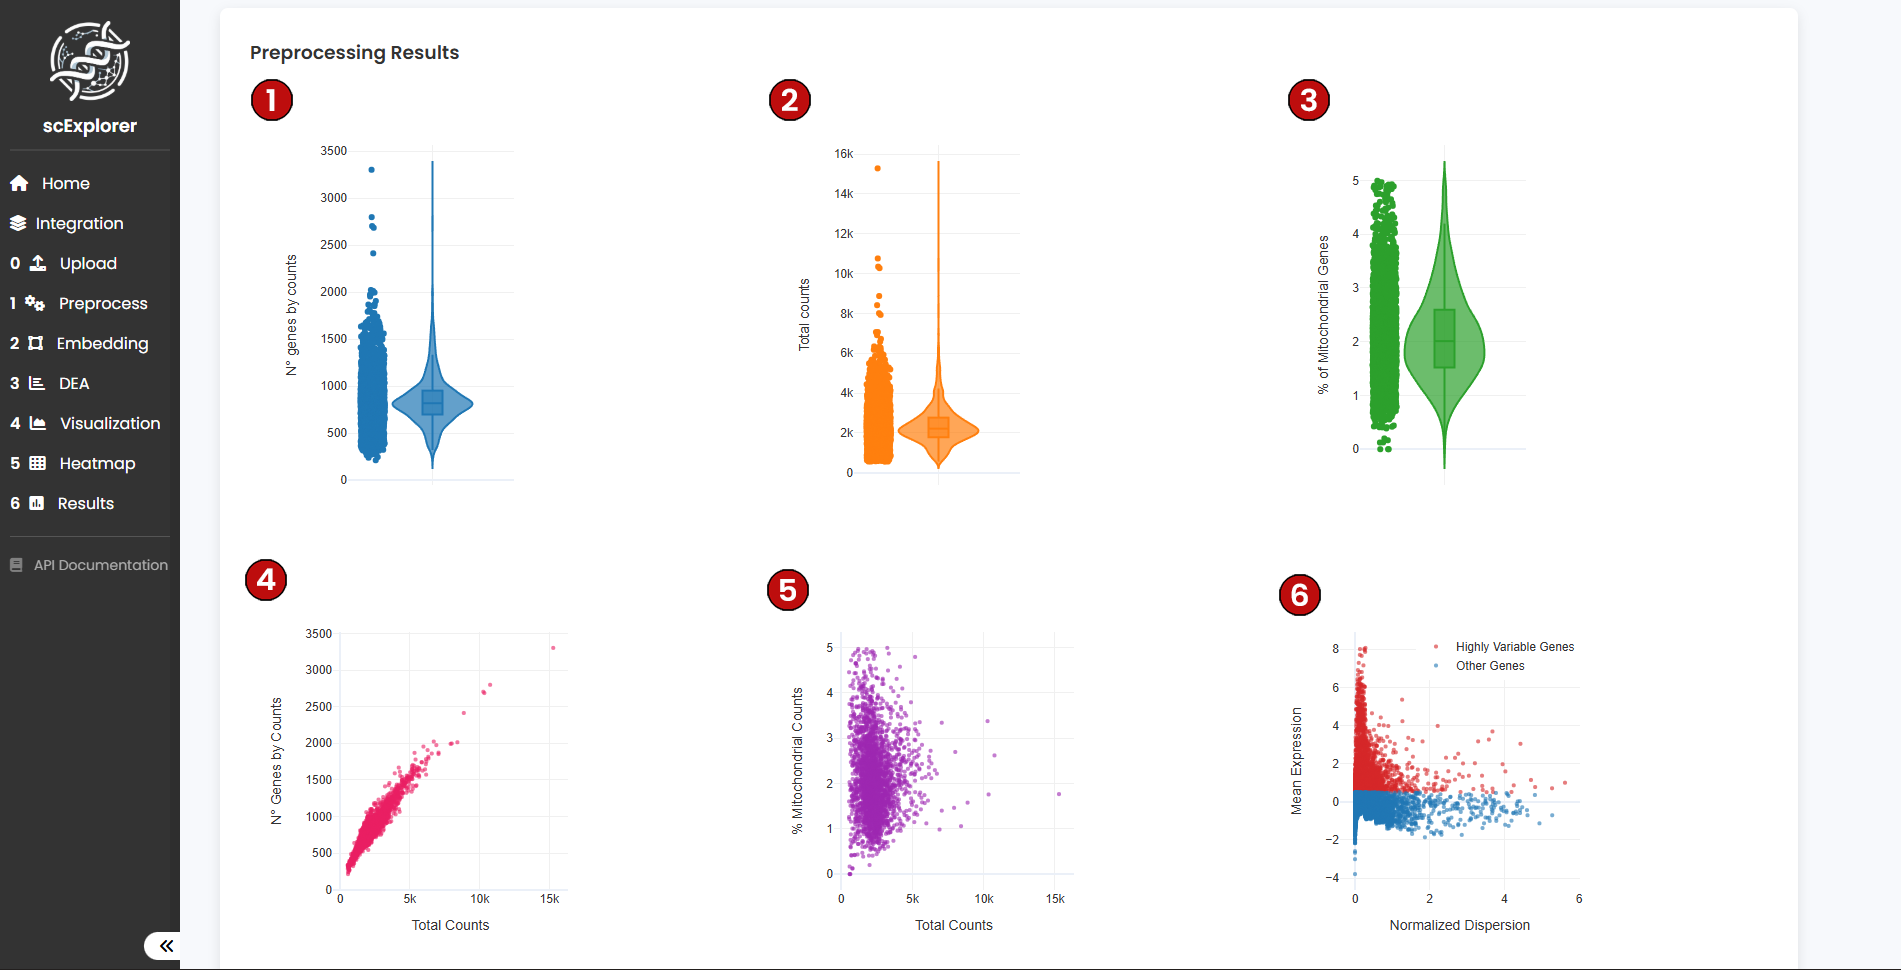
After running preprocessing, scExplorer will generate six quality control (QC) plots that help you evaluate whether the dataset is suitable for downstream analysis: