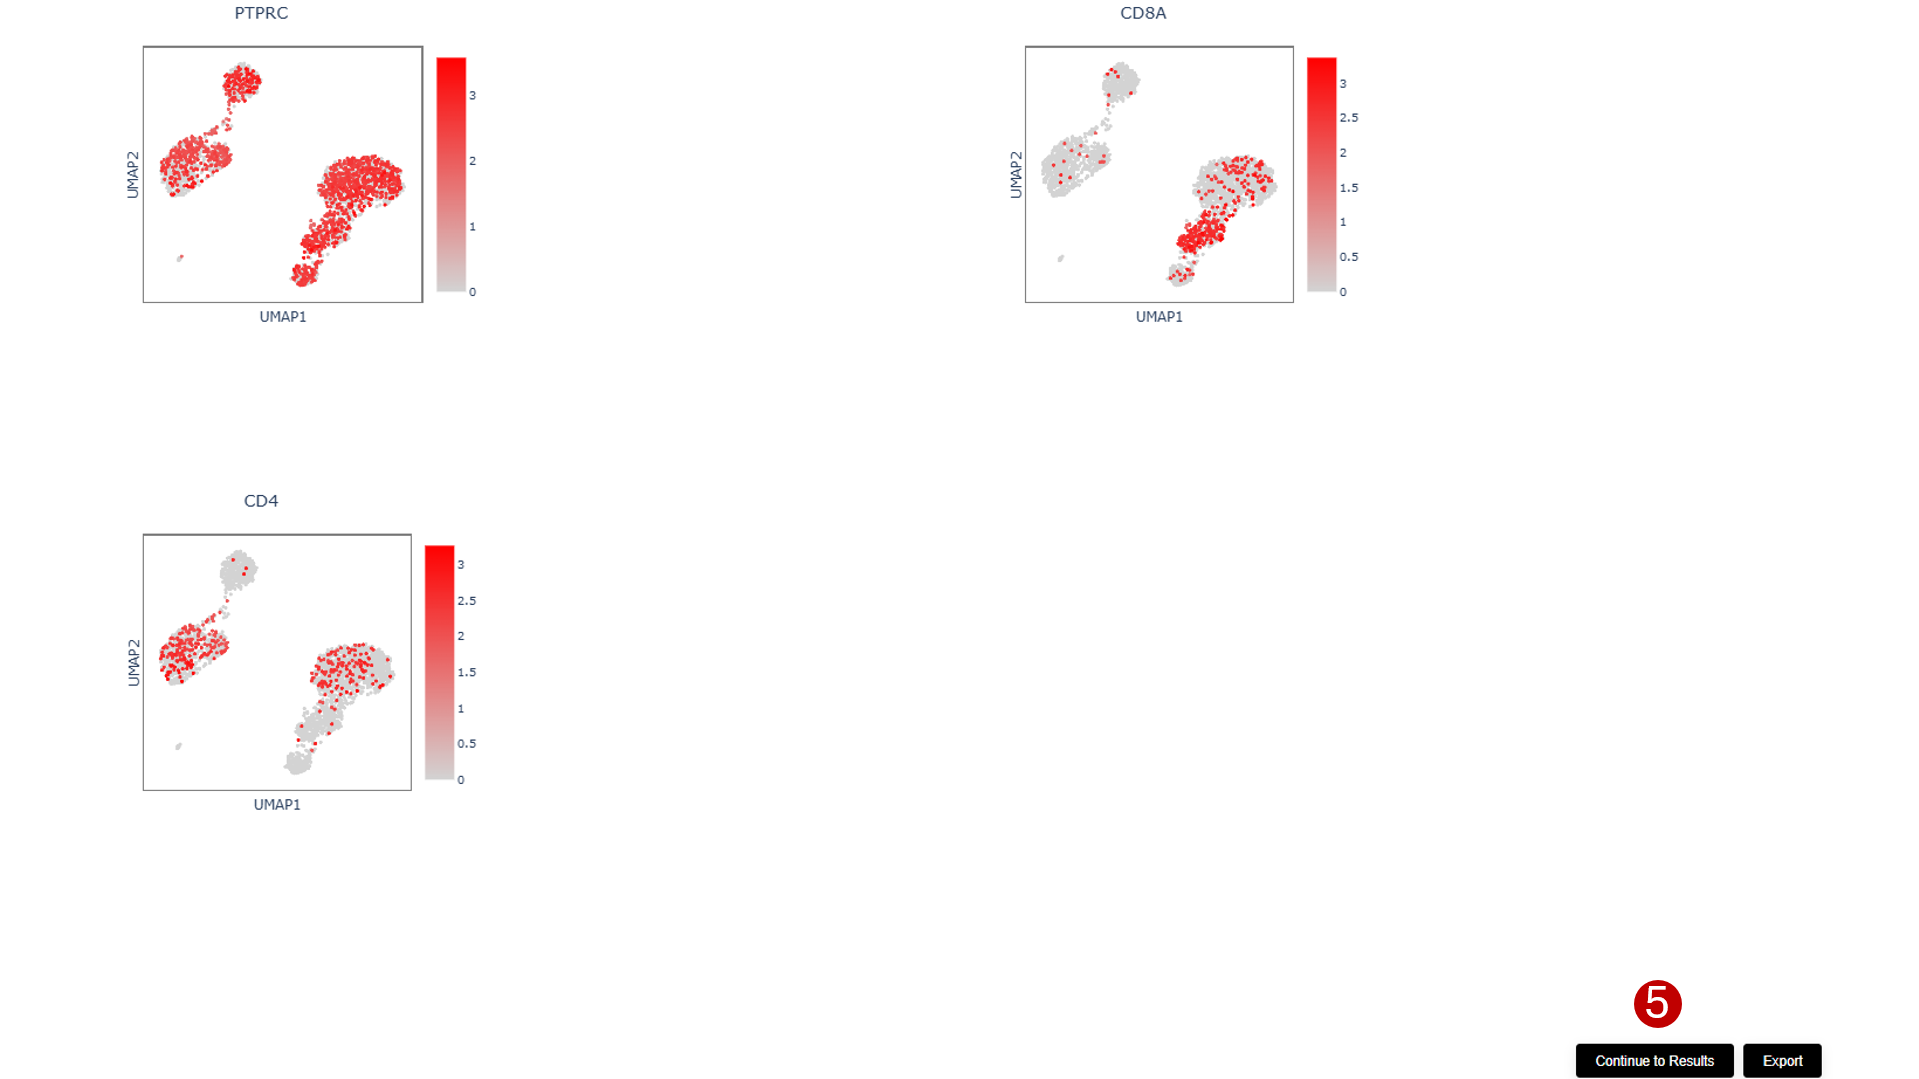
The visualization module allows you to explore gene expression patterns across your single-cell dataset by plotting specific genes of interest in reduced dimensional space (UMAP or PCA).
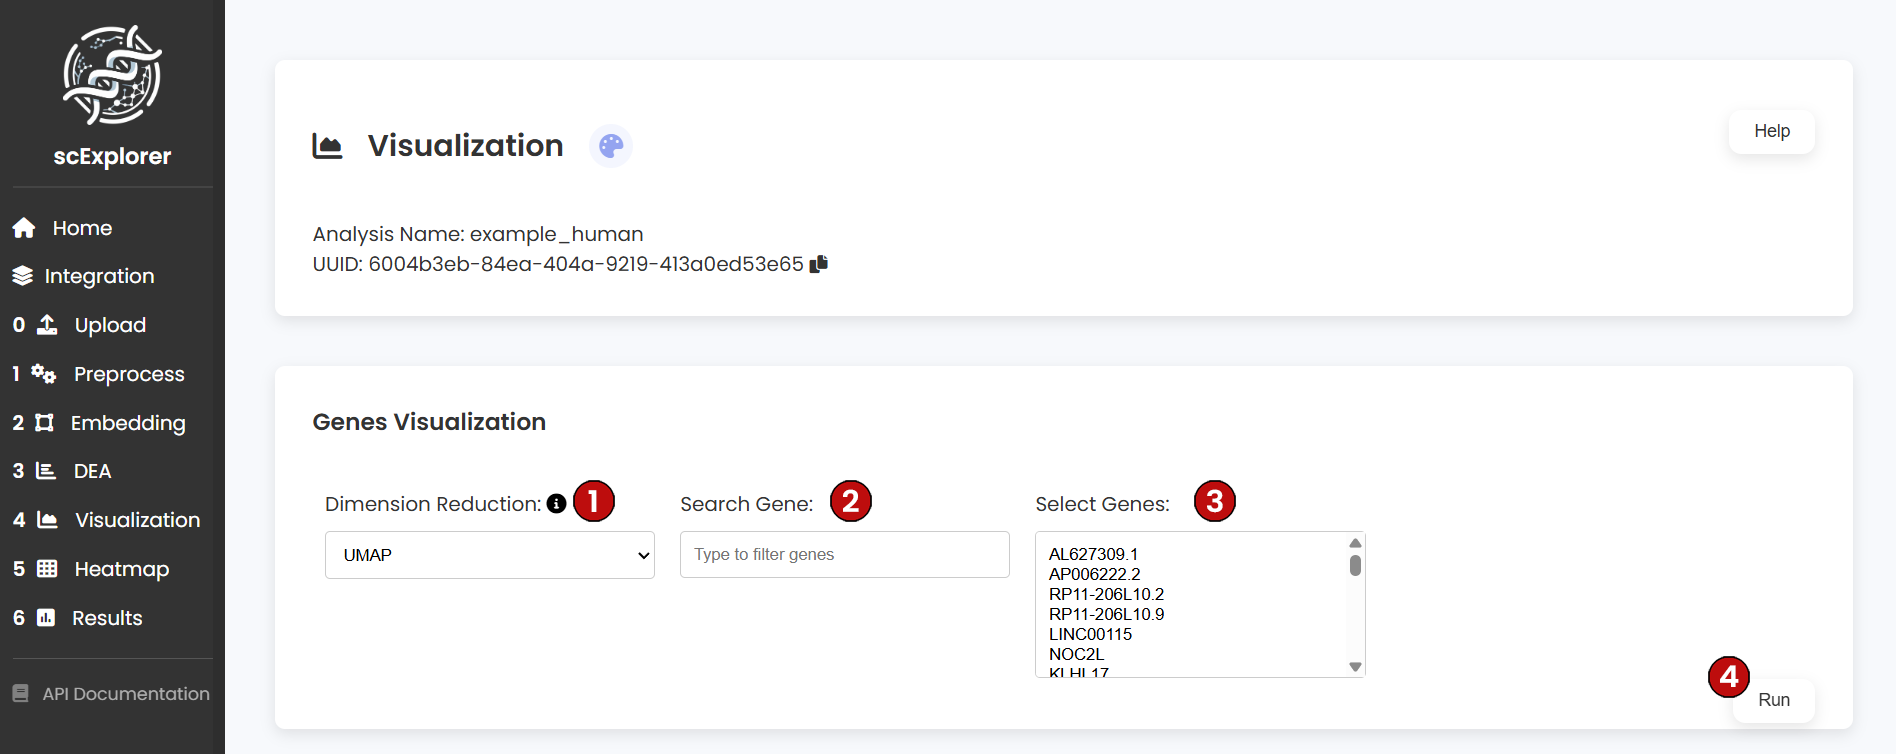
After running the visualization, you will see gene expression plots overlaid on your chosen dimensional reduction space. Each plot shows:
This spatial representation helps identify cell types, validate clustering results, and understand the biological context of your single-cell data.
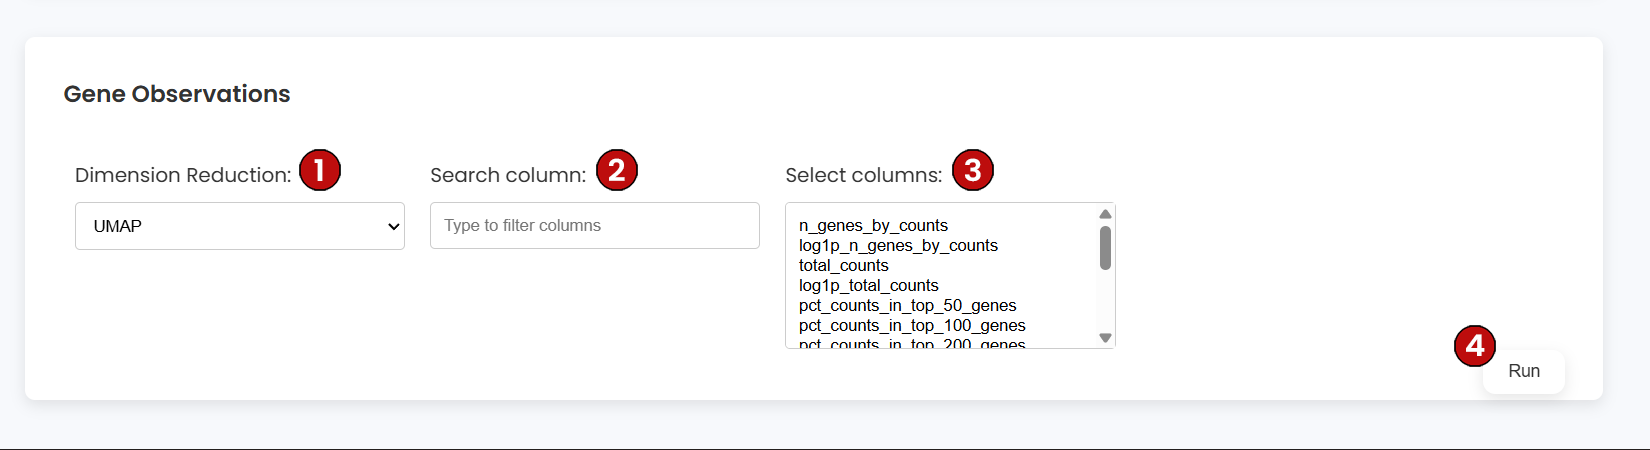
Use the Gene Observations container to color the embedding by per-gene metadata stored in var (e.g., total counts per gene, HVG flags). Configure:
var columns by name.var fields to visualize.Each resulting plot colors cells according to the selected per-gene metric aggregated over the embedding. Use this to inspect HVG selection, gene-level filters, or feature-wide summaries.
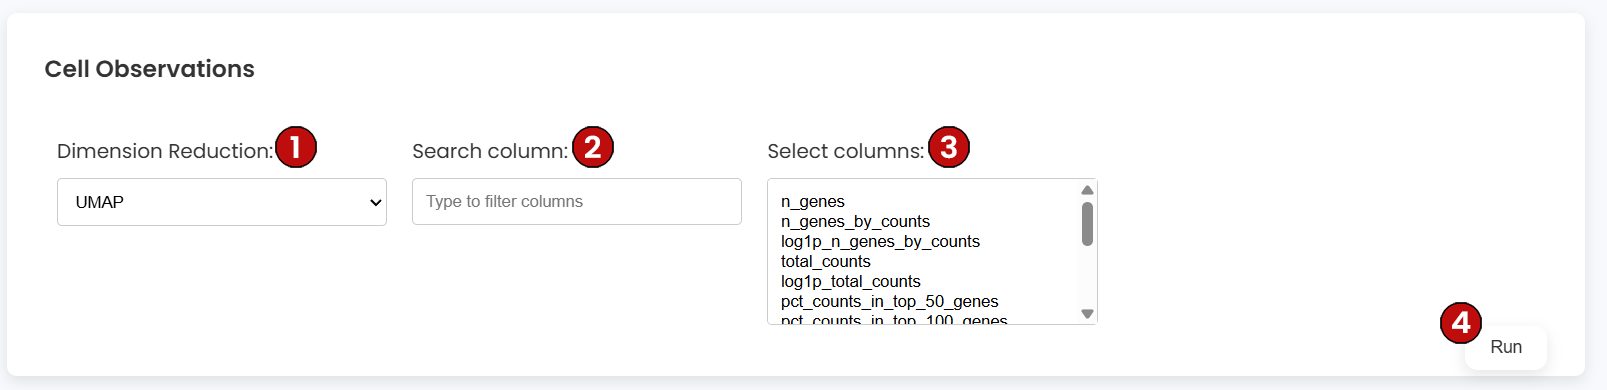
Use the Cell Observations container to color the embedding by per-cell metadata stored in obs (e.g., total counts, percent mitochondrial, Leiden cluster, user labels). Configure:
obs columns by name.obs fields to visualize (numeric or categorical).Plots use continuous scales for numeric columns and discrete palettes for categorical columns (e.g., clusters/labels). This is ideal for QC review and for verifying labeling decisions before downstream analyses.