Configure the heatmap plot using the numbered controls shown below, then run to visualize group-level patterns and marker genes.
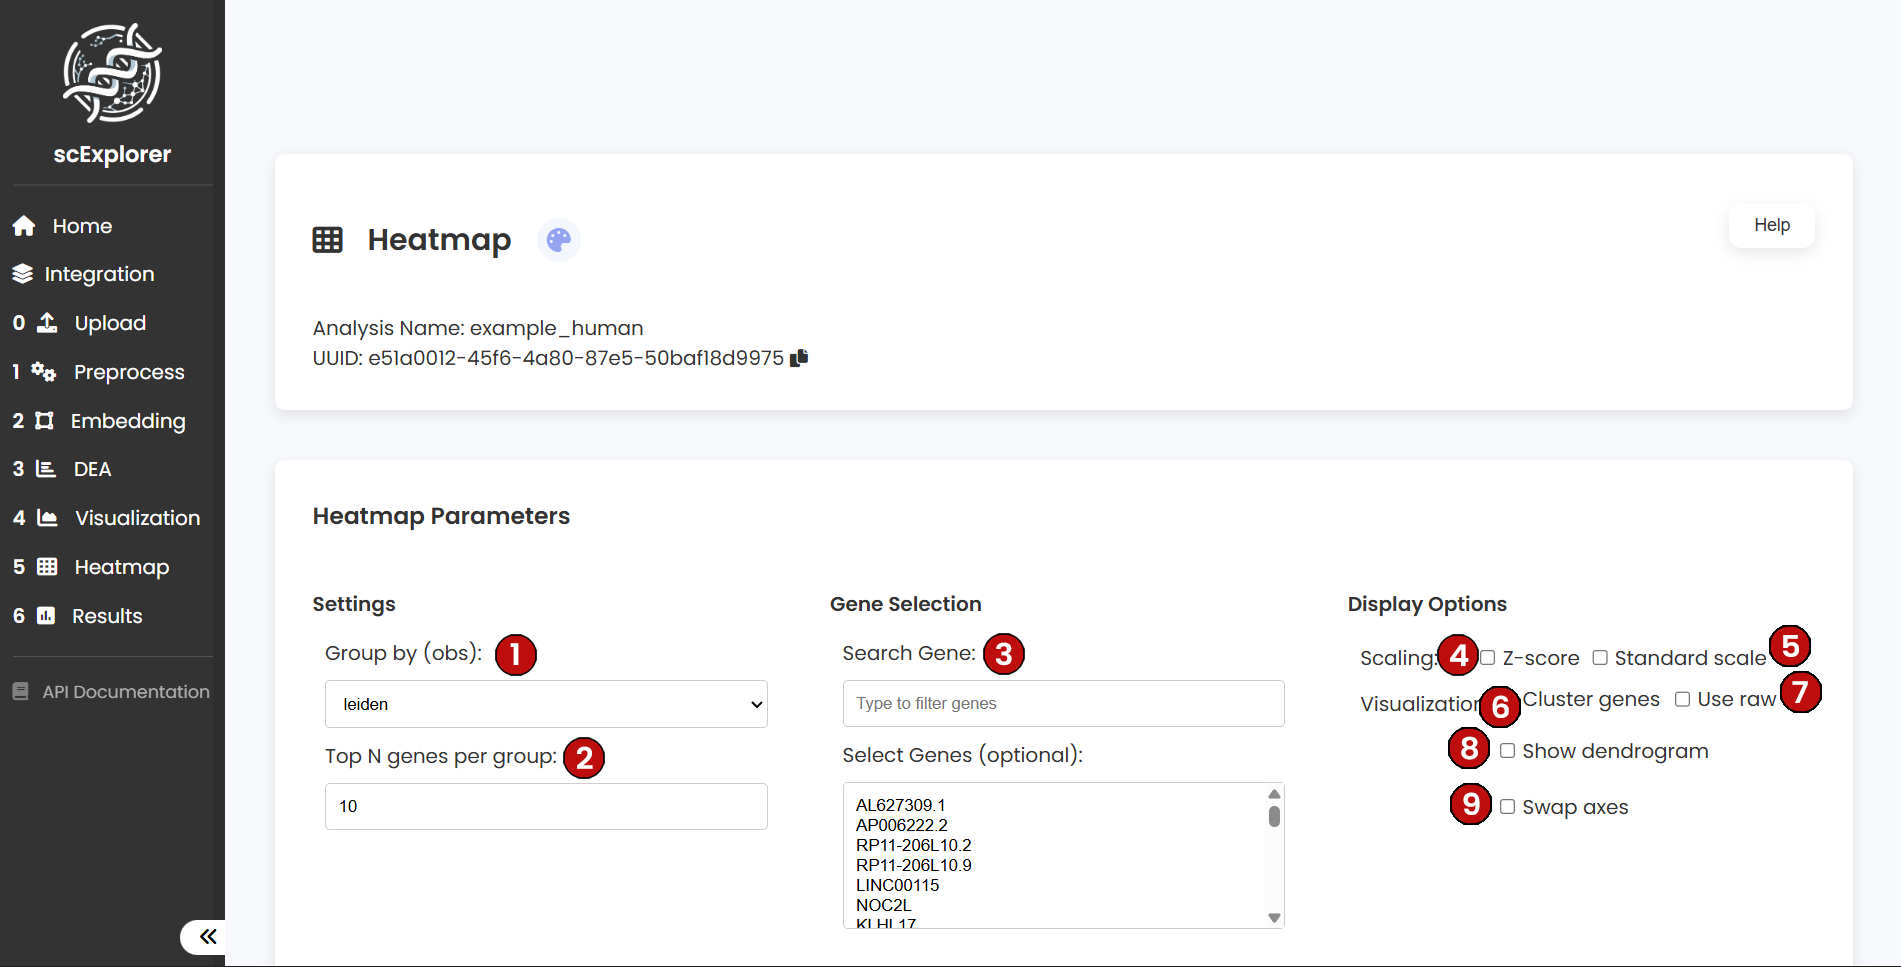
Parameters:
- (1) Group by (obs): Observation column to group cells (e.g.,
leiden or user labels). Defines category blocks.
- (2) Top N genes per group: If no manual genes are chosen, the top N per group are selected (from DEA/selection). Keep N reasonable for readability.
- (3) Search Gene: Filter the gene list to override automatic selection.
- (4) Scaling — Z‑score: Row-wise z-score per gene. When enabled you can optionally set vmin/vmax clip values for the color range.
- (5) Scaling — Standard scale: 0–1 scaling per gene. Avoid combining with z-score.
- (6) Cluster genes: Hierarchically cluster genes to group similar profiles.
- (7) Use raw: Plot raw counts instead of normalized values (generally off).
- (8) Show dendrogram: Display the clustering dendrogram for groups/genes when clustering is enabled.
- (9) Swap axes: Rotate layout (categories on x‑axis, genes on y‑axis) — Scanpy-style orientation.
📊 Tips
Use your labeled groups to compare putative cell types. Z‑score emphasizes relative patterns; standard scaling helps when ranges differ widely. Keep N around 10–50 for clear figures.
